A single-pass printer can change more than print speed. It may shorten queues, reduce handling, and help a plant meet tighter delivery windows. But faster output does not automatically mean stronger profits. The business case depends on what the machine replaces, how often it runs, and whether customers will pay for the added capacity.
Smithers’ report, The Future of Digital Printing to 2032, projected the global digital-printing market would grow from $167.5 billion in 2022 to $230.5 billion by 2032. That forecast signals opportunity, not guaranteed returns for any one print shop. What is the ROI of upgrading to a single-pass printer? To answer, compare the equipment’s full installed cost with measurable annual gains: labor hours saved, reduced make-ready and waste, lower outsourcing costs, and additional profitable jobs. Count ink, maintenance, financing, training, and downtime too.
The arithmetic can look convincing on a spreadsheet. Reality is messier. A printer rated for high output may sit idle if orders are seasonal, files need extensive preparation, or finishing becomes the bottleneck. A practical ROI estimate should use actual production logs, quoted service terms, and conservative utilization assumptions. This guide explains how to build that estimate, test payback scenarios, and identify the assumptions most likely to be wrong before committing capital.
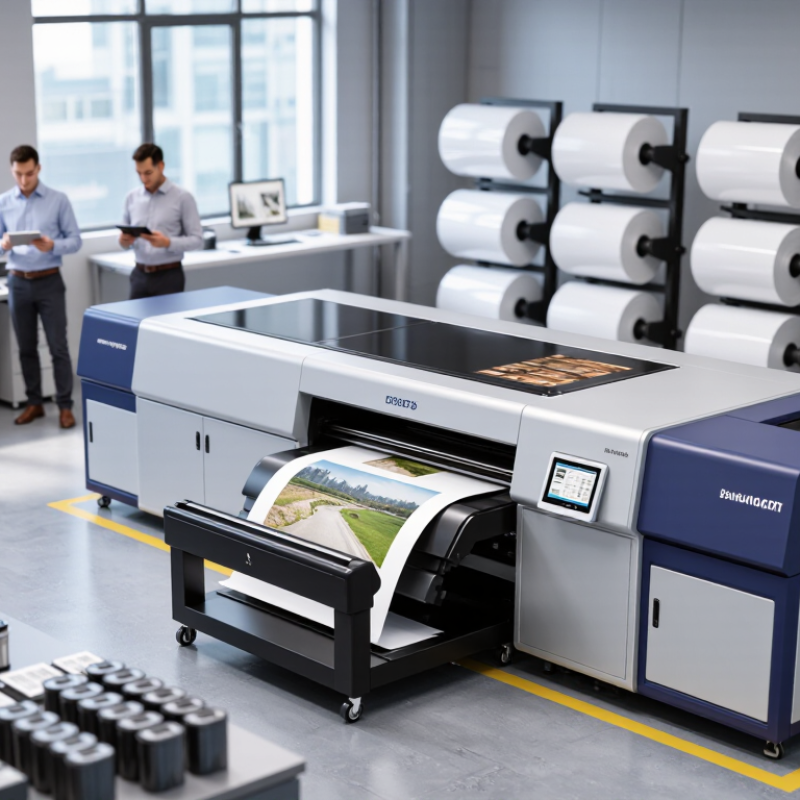
Define the Scope of the Single Pass Printer Upgrade
Before calculating ROI, define exactly what the upgrade includes. Is it only the single-pass print engine, or also unwinding, drying, inspection, software, and finishing? List each cost, including installation, operator training, maintenance, ink, energy, and production downtime. A machine price alone is not the investment.
Build a baseline from recent production records. Capture saleable output per shift, setup time, spoilage, labor hours, and outsourced work. Separate jobs that could realistically move to the new printer from jobs that cannot. Smithers’ report, The Future of Digital Printing to 2032, projects digital print’s global value will reach $230.5 billion by 2032. That market forecast signals opportunity, not guaranteed savings for any plant. Your own job mix matters more.
Define measurable benefits before comparing options: fewer changeovers, reduced waste, added sellable capacity, or lower outsourcing costs. Use actual job-level data where possible, and state assumptions for utilization and ramp-up. Include compatible finishing capacity; faster printing can simply move the bottleneck downstream. Keep the boundary clear. A neat spreadsheet can still miss a jam-prone shift or the cost of idle hours. Review the scope with production, maintenance, and finance, then calculate ROI using only benefits tied to this specific upgrade.
Establish Baseline Costs and Production Performance
Before estimating the return on a single-pass printer upgrade, record how the current line performs. Choose a representative period, such as four ordinary production weeks, and include busy and slow shifts. Track sellable output, running hours, changeovers, and unplanned stops. Separate good units from spoiled sheets or reprints. A headline speed means little if the line spends hours waiting for jobs or materials.
Build a baseline cost per sellable unit. Include ink, substrate waste, operator time, energy, routine maintenance, and outside finishing if applicable. Add downtime costs carefully: use documented lost production or overtime, not an optimistic guess. Keep it grounded. Compare invoices, shift logs, and job tickets; mismatches are common. Our records are rarely perfect, so note missing data rather than hiding it. That matters.
Measure quality and workflow, too. Record setup time for a typical job, color adjustments, rejected output, and the time needed to clear a queue. If possible, sample several jobs with different coverage and run lengths. A few fast jobs can distort the picture. Note assumptions such as shift length and scheduled utilization, then use the same definitions when evaluating the upgraded printer. These baseline figures give later ROI estimates a traceable starting point.
How to Calculate ROI of a Single-Pass Printer Upgrade
Establish baseline costs and production performance. The chart compares estimated monthly operating costs at the same output of 100,000 good units.
Illustrative estimate: At 100,000 good units per month, modeled throughput increases from 12,500 to 20,000 good units per shift. Estimated operating costs fall from $31,400 to $23,300 per month, saving $8,100 monthly. With an $84,000 upgrade investment, simple payback is approximately 10.4 months; estimated first-year ROI is 15.7%. Figures are assumptions for planning, not a supplier quote. Replace them with measured production, labor, consumables, rework, maintenance, and energy data.
Estimate Benefits and Ongoing Operating Costs
Calculate the upgrade using saleable output, not the printer’s rated speed. Track actual jobs for several weeks: sheets per hour, setup time, rejects, and operator hours. Then estimate added contribution margin from work you can genuinely sell. For example, saving 12 labor hours weekly is not a full benefit if those hours simply become idle time. A spreadsheet can overpromise. Check it against the production floor.
List ongoing costs separately: ink, printheads, maintenance, energy, substrate waste, training, and financing. The U.S. Energy Information Administration reported an average commercial electricity price of 12.69 cents per kilowatt-hour in 2023. At that benchmark, an upgrade drawing an additional 20 kW for 1,800 hours costs about $4,568 yearly in electricity. Use your own utility rate and measured load instead; the benchmark is only a reference. Ask suppliers for documented consumption and service estimates, then verify them after installation. Include downtime, too. It matters. Calculate annual net benefit as added contribution margin plus verified savings, minus recurring costs. Divide the purchase and installation cost by that net benefit for a simple payback estimate. Review the assumptions monthly; early waste and maintenance can differ from the quote.
How to Calculate ROI of a Single Pass Printer Upgrade - Estimate Benefits and Ongoing Operating Costs
Illustrative annual estimate for a facility printing 1,000,000 m². Figures are planning assumptions in USD, not vendor quotations. Actual results depend on print quality, substrate, production mix, utilization, and local costs.
Operating Assumptions
| Input |
Current Production Setup |
Single Pass Upgrade |
Basis |
| Annual saleable print volume |
1,000,000 m² |
1,000,000 m² |
Same annual volume used for both cases |
| Direct operating staff |
2 FTE |
1 FTE |
Illustrative staffing requirement at the modeled volume |
| Loaded annual labor cost per FTE |
$52,000 |
$52,000 |
Salary plus employer costs; replace with local labor data |
| Energy cost per printed m² |
$0.12 |
$0.08 |
Illustrative electricity and production-energy allocation |
| Ink cost per printed m² |
$0.42 |
$0.36 |
Illustrative average across the production mix |
| Waste and rework rate |
5% |
2% |
Applied to annual volume at an estimated $1.80 per affected m² |
Estimated Annual Ongoing Operating Costs
| Cost Category |
Current Setup |
Single Pass Upgrade |
Annual Cost Change |
| Direct production labor |
$104,000 |
$52,000 |
-$52,000 |
| Maintenance and service |
$48,000 |
$72,000 |
+$24,000 |
| Energy |
$120,000 |
$80,000 |
-$40,000 |
| Ink |
$420,000 |
$360,000 |
-$60,000 |
| Waste and rework |
$90,000 |
$36,000 |
-$54,000 |
| Total annual operating cost |
$782,000 |
$600,000 |
-$182,000 |
Investment and ROI Estimate
| Measure |
Calculation |
Estimated Result |
| Equipment upgrade investment |
Estimated equipment purchase |
$550,000 |
| Integration and installation |
Estimated one-time cost |
$35,000 |
| Training and commissioning |
Estimated one-time cost |
$15,000 |
| Total initial investment |
$550,000 + $35,000 + $15,000 |
$600,000 |
| Net annual operating savings |
Current annual costs − upgraded annual costs |
$182,000 |
| Simple annual ROI |
$182,000 ÷ $600,000 × 100 |
30.3% |
| Simple payback period |
$600,000 ÷ $182,000 |
3.30 years |
| Five-year cumulative operating savings |
$182,000 × 5 years |
$910,000 |
| Five-year net benefit after initial investment |
$910,000 − $600,000 |
$310,000 |
| Five-year ROI |
($910,000 − $600,000) ÷ $600,000 × 100 |
51.7% |
Cost changes are shown from the current setup’s perspective: negative values indicate savings, while positive values indicate higher costs. The estimate excludes financing, taxes, depreciation, inflation, discounting, changes in product mix, and any additional revenue from increased capacity.
Calculate ROI and Payback Period
To calculate the payback period, compare the upgrade’s installed cost with its annual net benefit. Include the printer, installation, operator training, and any required workflow changes. Then estimate measurable gains, such as reduced labor, less outsourced overflow, lower waste, and additional contribution from work the current line cannot handle.
For example, assume installation costs $60,000. The upgrade saves $22,000 in labor, adds $38,000 in contribution from new production, and reduces waste by $8,000 each year. If maintenance and other added operating costs total $20,000 annually, net annual benefit is $48,000. Payback is $60,000 divided by $48,000, or 1.25 years. That is about 15 months. Using a simple annual ROI, divide the $48,000 net benefit by the $60,000 investment: 80%.
Use actual figures from production records, not best-case estimates. Check setup time, operator coverage, consumables, and realistic demand for added capacity. A short pilot can reveal bottlenecks that a spreadsheet misses. Be cautious with projected revenue; a faster press does not guarantee more orders. Our estimate may still be imperfect, especially when demand shifts month to month. Recalculate with conservative volume and include downtime before making a decision.
Conclusion
This guide explains how to assess the financial case for a single-pass printer upgrade, starting by defining exactly what the project includes, such as equipment, installation, and workflow changes. It then recommends documenting current production performance and baseline costs—including labor, materials, maintenance, downtime, and output—so the upgrade can be compared against a clear starting point.
To estimate the value of the investment, identify potential gains such as higher throughput, reduced labor requirements, less waste, or improved uptime, and compare them with new ongoing expenses. Use these figures to calculate ROI and the payback period. Because actual results may differ from initial estimates, test the calculation under multiple scenarios by adjusting key assumptions, such as production volume, cost savings, and operating expenses. This approach helps answer the question, “What is the ROI of upgrading to a single-pass printer,” with a practical estimate grounded in the business’s own conditions.

 DD-Tech Print