How to Convert a Traditional Textile Mill to a Smart Factory

Time:2026-10-26 Author:Isabella
0%

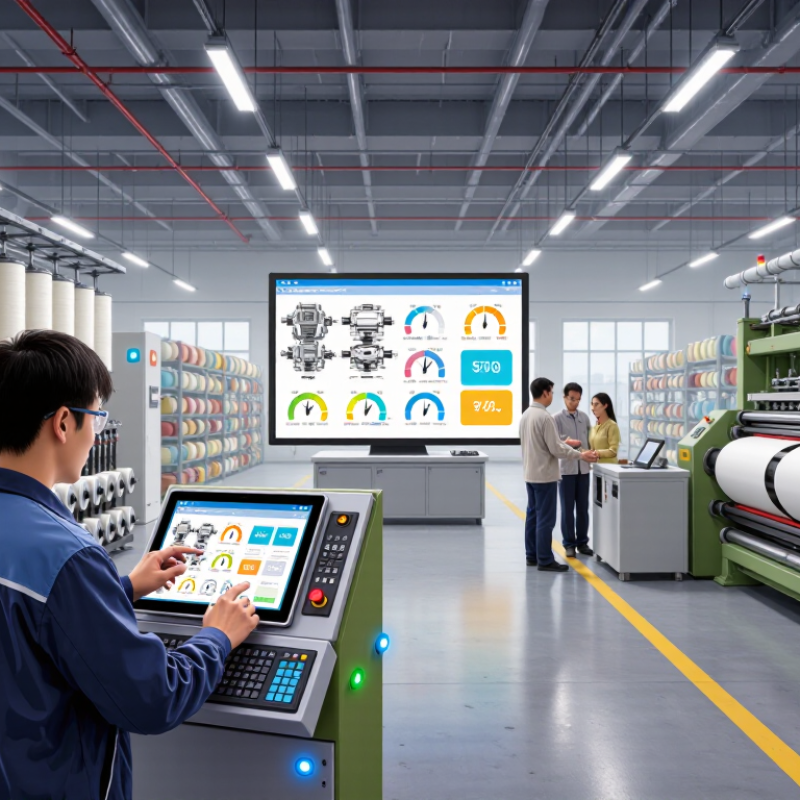
Converting a traditional textile mill into a digital facility is not simply a matter of installing sensors and buying new software. It requires a practical redesign of how yarn, fabric, energy, people, and information move through the plant. This article examines How to convert a traditional textile mill to a digital facility, from the first machine audit to connected production control.

Prof. Dr. Thomas Gries, Director of the Institute for Textile Technology at RWTH Aachen University, has emphasized a valuable principle: “Digitalisation is not an end in itself; it must improve productivity, quality, and sustainability.” That idea should guide every investment. A temperature sensor on a dyeing machine matters only when it prevents shade variation or reduces water consumption. A digital dashboard matters only when supervisors can act before a loom stops.

The conversion usually begins with reliable data collection. Older looms may need retrofit devices, while newer equipment can connect through industrial gateways. Operators should see clear alerts, not endless graphs. Small trials are safer than a factory-wide replacement. One production line can test predictive maintenance, electronic quality records, and energy monitoring before broader deployment.

The process will not be perfect. Some machines may produce incomplete data. Workers may distrust unfamiliar interfaces. Cybersecurity risks also require disciplined access controls and regular updates. These weaknesses deserve attention, not concealment. A successful digital facility combines engineering judgment, operator experience, measurable results, and continuous review. Technology opens the door, but people determine whether the mill truly becomes smarter.
How to Convert a Traditional Textile Mill to a Smart Factory

Assess the Mill’s Current Processes, Equipment, and Digital Readiness

Converting a traditional textile mill into a smart factory begins with an honest assessment, not a technology purchase. Walk through every production stage, from yarn preparation to finishing. Record waiting time, rework, manual entries, and machine stoppages. A paper-based workflow may appear simple, but hidden delays often sit between departments. The first process map is rarely accurate. Ask operators to correct it.

Inspect each machine carefully. Note its age, control system, maintenance history, energy use, and connection options. A modern sensor cannot repair worn rollers or unstable power. Review three months of breakdown records, quality reports, and production schedules. Compare planned output with actual output. These figures reveal whether the main problem is equipment, planning, skills, or material flow. Do not ignore older machines. Some can provide useful data through simple external sensors.

Tips: Create a readiness score for each production area. Rate process stability, equipment condition, data quality, staff capability, and network access from one to five. Interview operators during active shifts, not only in meetings. Test a small data collection trial on one machine. Check whether readings are consistent before expanding. Keep the results visible and auditable.

Digital readiness also depends on people. Confirm who owns production data, who checks errors, and who responds to alerts. Train supervisors to question unusual readings instead of trusting every dashboard. Our assessments sometimes expose weak assumptions, including inaccurate downtime categories or incomplete maintenance logs. That is uncomfortable, but useful. A smart factory needs reliable foundations before advanced automation can deliver measurable value.

Define Smart Factory Goals, Standards, and Performance Metrics

How to Convert a Traditional Textile Mill to a Smart Factory

Define Smart Factory Goals, Standards, and Performance Metrics

A smart factory conversion should begin with measurable production problems, not fashionable technology. In a textile mill, leaders may target fewer loom stoppages, lower fabric defects, and better energy control. Each goal needs an owner, a baseline, and a review date.

For example, reduce unplanned loom downtime from 12% to 8% within six months. Keep the target visible.

Standards make measurements trustworthy. Define how machines record runtime, stoppages, waste, speed, and quality results. Use the same terms across weaving, dyeing, finishing, and maintenance teams. Sensors should receive regular calibration checks. Data access must follow clear permissions and secure operating procedures. Worker safety remains a fixed requirement, even when automation increases. A connected machine is not automatically a reliable machine.

Performance metrics should connect shop-floor activity with business value. Useful indicators include:

  • overall equipment effectiveness
  • first-pass quality
  • changeover time
  • energy per kilogram
  • maintenance response time

Display current values near production areas, not only in management offices. Review abnormal readings with operators because numbers can hide practical causes. A humidity sensor may report normal conditions while a blocked air vent affects one loom row.

Early dashboards are often too crowded. That mistake is common. Remove metrics that do not support a decision.

Targets may also need revision when product mix, staffing, or seasonal humidity changes. A short monthly review can expose weak assumptions before they become expensive standards.

Upgrade Machines with Sensors, Connectivity, and Industrial Control Systems

Converting a traditional textile mill into a smart factory starts with the machines already on the floor. Inspect each loom, dyeing unit, and finishing line before choosing sensors. Temperature probes can reveal overheating bearings, while vibration sensors detect unusual movement early. Current sensors also show when motors consume more energy than normal. Small details matter, such as dust, heat, and washdown water.

Temperature probes can reveal overheating bearings, while vibration sensors detect unusual movement early.

During a mill retrofit, install sensors at accessible points and protect cables inside sealed conduits. Connect them through industrial gateways that support the mill’s existing control equipment. A segmented network helps separate production traffic from office systems. Industrial control systems can then collect machine data, manage alarms, and adjust approved operating parameters. Keep safety interlocks independent from routine monitoring. Safety cannot depend on a dashboard.

A practical pilot might cover ten looms for four weeks. Compare sensor readings with operator logs and maintenance records. Our first data review might expose false alarms caused by loose mounting. That is useful, not failure. Calibrate sensors regularly, label every device, and record firmware or configuration changes.

Operators should see simple alerts near the machine, not confusing charts. The system must support their judgment, because experienced workers often notice a problem before the data does.

Databases also need access controls, backups, and clear retention rules. Data quality is still the weak link.

Integrate Production Data Through a Centralized Digital Platform

How to Convert a Traditional Textile Mill to a Smart Factory

Converting a traditional textile mill into a smart factory starts with a shared view of production data. Machines, inspection stations, warehouses, and maintenance teams often record events differently. A centralized digital platform can connect these sources through secure interfaces and consistent data fields. It should capture spindle speed, loom downtime, batch numbers, energy use, and defect rates in near real time. This creates one operational record instead of scattered spreadsheets and handwritten notes.

In practice, integration begins with a small production area. We map each signal, define ownership, and test readings against physical conditions. For example, a platform alert should match a stopped loom, not a faulty sensor. Operators need clear screens showing order status, downtime causes, and pending quality checks. Keep it simple. Cleaning duplicate batch records may reveal errors managers previously accepted as normal. That work is slow, but it improves planning and traceability.

The transition is rarely perfect. Our first dashboard exposed missing timestamps and inconsistent defect codes. That was uncomfortable, yet useful. We revised data rules with operators instead of imposing them from an office. Access controls, backups, audit trails, and network segmentation protect reliable information. Staff training must include what to do when data looks wrong. A smart platform should support human judgment, not replace it. If production targets change, the data model may need revision too.

Deploy Analytics, Workforce Training, and Continuous Improvement Practices

Converting a traditional textile mill begins with evidence, not expensive equipment. Install sensors on looms, dyeing vessels, compressors, and boilers. Track vibration, temperature, energy use, humidity, and defect rates. A shared dashboard can expose patterns hidden in paper logs. One mill found thread breaks increased after evening humidity changes. The response was practical: adjust ventilation and inspect tension settings before replacing machinery. Data needs context. A number without an operator’s explanation can mislead.

Workforce training should happen beside the machines. Operators can learn to read trend lines, verify alarms, and record causes accurately. Short sessions work better than abstract presentations. Use a stopped loom to practice safe checks, sample inspection, and restart decisions. Supervisors should explain why each metric matters. Trust grows when workers see their knowledge influencing the dashboard. Our first training draft was too technical. Several experienced operators disengaged. We revised it with photographs, local terms, and real shift records.

Continuous improvement requires a visible routine. Hold brief daily reviews near the production board. Select one issue, test one change, and measure the result for a defined period. Record who changed what, under which conditions, and with what outcome. Small experiments might reduce yarn waste by adjusting speed in two looms. Not every trial succeeds. That is useful evidence. Review failed tests without blaming individuals, then update work instructions. Managers should audit data quality monthly and invite independent safety or process specialists when risks remain unclear. Automation should support judgment, not erase it.

How to Convert a Traditional Textile Mill to a Smart Factory — Deploy Analytics, Workforce Training, and Continuous Improvement Practices
Operational transformation dashboard | Anonymized textile-mill planning dataset | Baseline compared with six-month progress and twelve-month targets
Workstream Data Dimension Unit Baseline 6-Month Progress 12-Month Target Change vs. Baseline Recommended Action Priority
Production Analytics Overall Equipment Effectiveness (OEE) % 58.0 66.5 72.0 +14.0 percentage points Combine availability, performance, and quality data in a daily loss-tree review. High
Production Analytics Unplanned Downtime hours/month 184 151 120 −34.8% Use machine-condition alerts and standardized root-cause analysis for recurring failures. High
Quality Management First-Pass Yield % 91.2 93.8 96.0 +4.8 percentage points Link inspection results to machine settings, yarn lots, and operator shifts. High
Quality Management Defect Rate defects per 100 m 4.6 3.4 2.5 −45.7% Apply Pareto analysis to the most frequent defects and verify corrective actions weekly. High
Energy Analytics Electricity Intensity kWh per kg of fabric 2.85 2.62 2.35 −17.5% Install sub-metering by process area and schedule high-load equipment during efficient operating windows. Medium
Maintenance Mean Time Between Failures (MTBF) hours 96 118 140 +45.8% Convert preventive-maintenance tasks into condition-based work orders using failure history. High
Maintenance Mean Time to Repair (MTTR) minutes 74 63 55 −25.7% Maintain digital equipment histories, spare-parts visibility, and standardized repair instructions. Medium
Workforce Training Digital-Tool Certification Coverage % of relevant employees 18 64 95 +77 percentage points Certify operators and technicians in dashboard use, data capture, cybersecurity, and escalation procedures. High
Workforce Training Training Hours per Employee hours/employee/year 12 22 32 +166.7% Use short, role-specific modules supported by supervised practice on production equipment. Medium
Continuous Improvement Verified Improvement Actions Closed actions/month 9 17 25 +177.8% Run weekly improvement meetings with accountable owners, due dates, and measured results. Medium
Supply Chain On-Time-In-Full Delivery % of orders 86.0 91.5 95.0 +9.0 percentage points Connect production status, quality release, inventory, and dispatch data to a shared order view. High
Data Governance Automated Data-Capture Coverage % of critical process points 22 58 85 +63 percentage points Standardize tags, timestamps, equipment IDs, and data-quality ownership before scaling analytics. High
Measurement basis: OEE is calculated from availability, performance, and quality. First-pass yield excludes reworked units. Electricity intensity is measured from process-level electricity consumption divided by kilograms of fabric produced. MTBF and MTTR should be calculated from time-stamped maintenance events. Targets should be validated against the mill’s product mix, equipment condition, shift pattern, and verified production records.

FAQS

Which machines should a traditional textile mill monitor first?

Start with looms, dyeing units, finishing lines, compressors, and boilers. Track vibration, temperature, energy use, humidity, and defect rates. Begin with a manageable area.

Where should sensors be installed?

Place sensors at accessible points near bearings, motors, and process equipment. Protect cables inside sealed conduits against dust, heat, and washdown water. Loose mounting can create false alarms.

How can industrial control systems support a retrofit?

Industrial gateways can connect new sensors with existing control equipment. A segmented network separates production traffic from office systems. Keep safety interlocks independent from routine monitoring.

What should a practical pilot project include?

A useful pilot might monitor ten looms for four weeks. Compare sensor readings with operator logs and maintenance records. Check unusual readings before changing equipment.

How should workers respond to machine alerts?

Show simple alerts near the machine, not confusing charts. Operators should verify alarms and explain likely causes. Experienced workers may notice trouble before data does.

Why does data need operational context?

A number without an operator’s explanation can mislead decisions. For example, evening humidity may increase thread breaks. Ventilation and tension settings might need inspection.

What makes workforce training effective?

Train beside operating machines, using photographs and real shift records. Practice safe checks, sample inspection, and restart decisions on a stopped loom. Our first training draft was too technical.

How should a mill manage continuous improvement?

Hold brief daily reviews near the production board. Choose one issue, test one change, and measure results for a defined period. Small experiments can reduce yarn waste. Not every trial succeeds.

How should machine data be protected and maintained?

Use access controls, backups, clear retention rules, and regular calibration. Label every sensor and record firmware or configuration changes. Review data quality monthly. It remains the weak link.

Conclusion

How to convert a traditional textile mill to a digital facility begins with a clear understanding of its existing processes, machinery, production challenges, and level of digital readiness. The transformation should establish practical goals, operating standards, and measurable performance indicators, such as productivity, product quality, energy efficiency, equipment availability, and order accuracy. This assessment creates a realistic roadmap for modernization while aligning technology investments with business needs.

The next stage is to equip machines with suitable sensors, connectivity, and industrial control systems that can capture reliable production data in real time. A centralized digital platform can then integrate information from manufacturing, maintenance, quality control, inventory, and energy management, giving teams a complete view of operations. With analytics, managers can identify bottlenecks, predict maintenance needs, reduce waste, and support faster decisions. Workforce training and continuous improvement practices are equally important, ensuring employees can use new tools effectively and contribute ideas for long-term operational improvement.

Isabella

Isabella

Isabella is a dedicated marketing professional with a sharp focus on driving brand growth and engagement through strategic content creation. With an extensive background in digital marketing, she combines her passion for storytelling with her keen understanding of industry trends to deliver......